 EvenMoreAware Capacity Dashboard
What does it do?
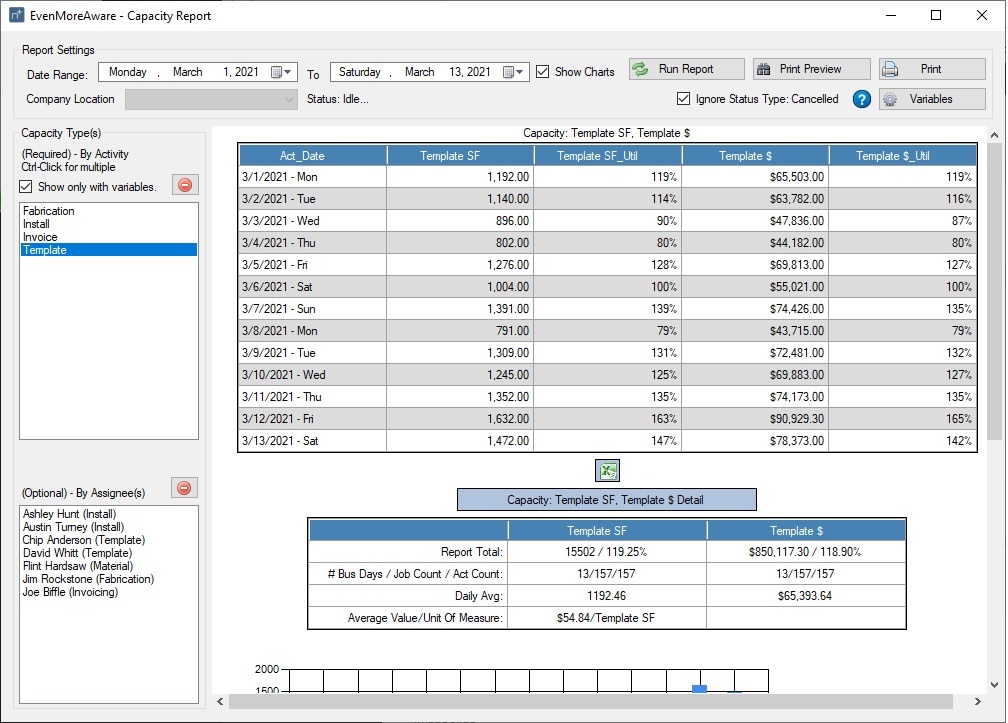
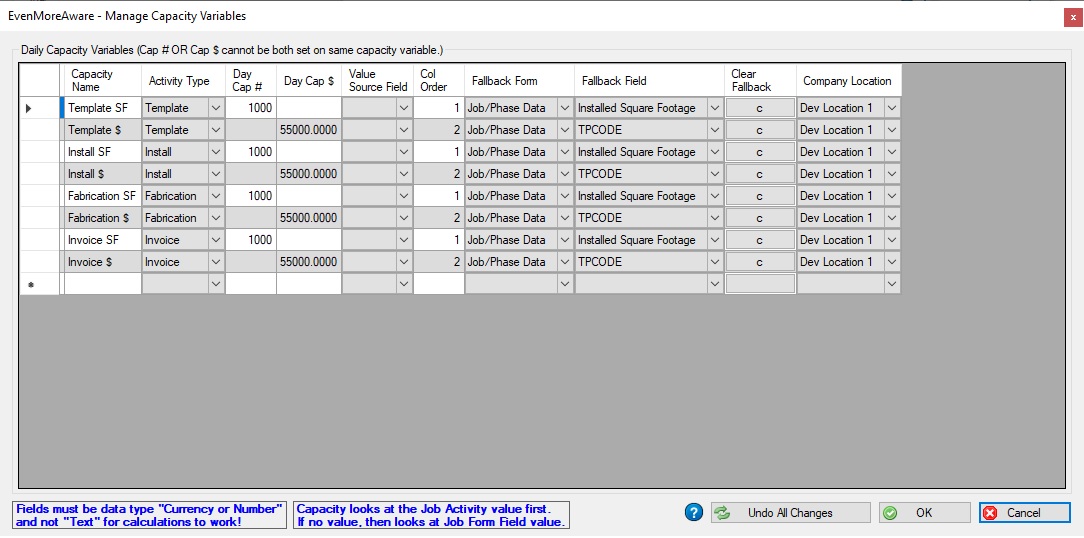
- Gives the ability to associate a value with any given activity and pull date related reports.
- Reporting can also be broken down by assignee (in addition to activity type).
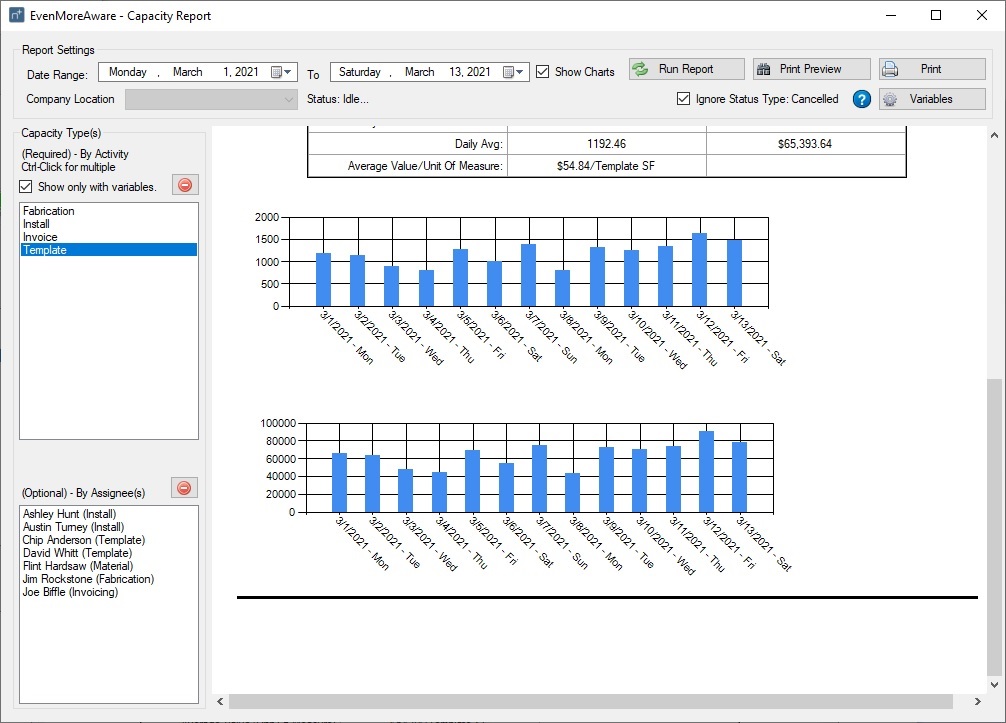
- Data is put into a bar chart for easy viewing with a summary table.
- Shows what percentage of set capacity is being utilized.
- All reports can be exported into Excel for further analysis.
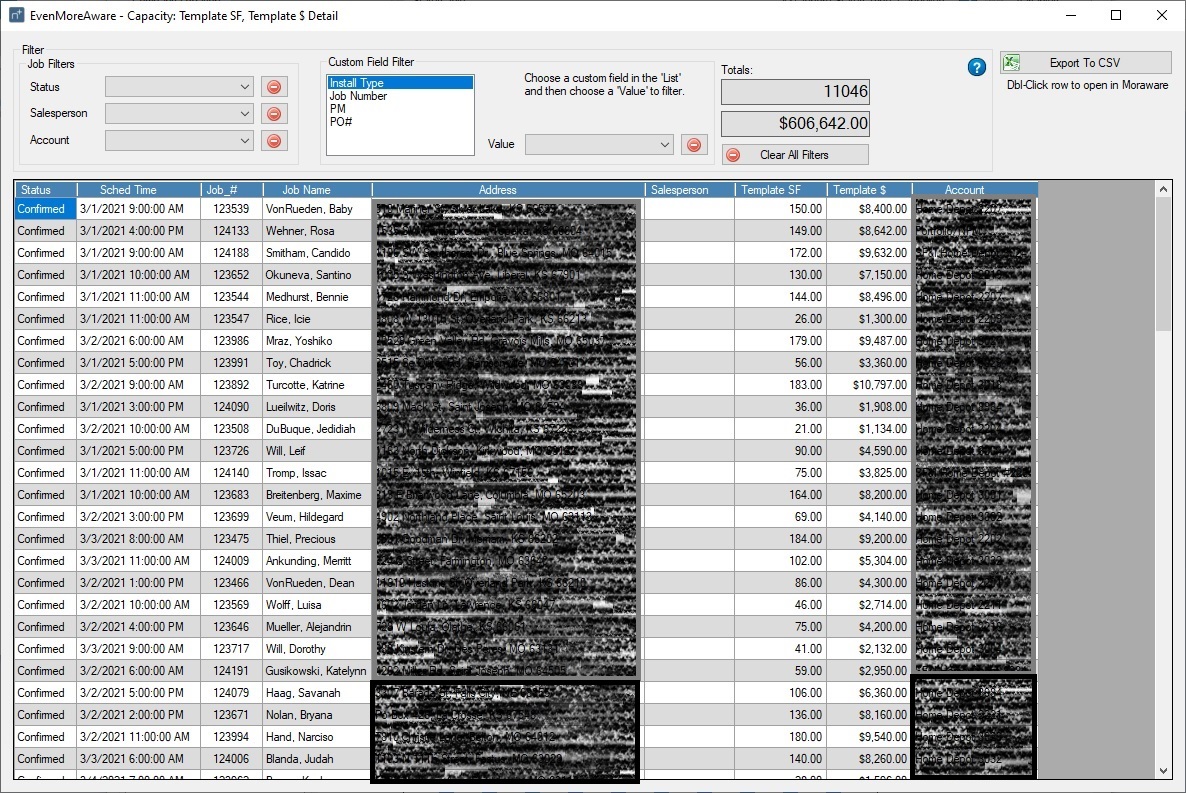
- Easily create a report for sales staff showing current monthly numbers and compare to your accounting system to ensure accuracy of invoicing.
- Helps show backlog of jobs over any given period of time to assist in proper staffing and shop capacity.
- Breaks down data to obtain results specific to individual customer or values.
- Talks directly to Moraware for accurate and timely data.
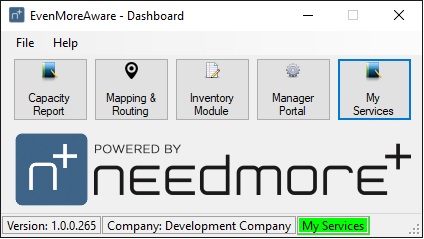
Summary
The capacity dashboard gives visibility into your system and data to give you a better picture of how your business is performing. It helps you see into the past or future and pull data to help grow your business. Because you can break down data to specific assignee’s or activities you can see where inefficiencies are and improve in those areas. By setting a numerical variable you can track where you want to be for production volume or revenue dollars and ensure you are hitting those goals.

